Using Nonlinear Dynamics for Signal Analysis in Transpalpebral Rheoophthalmography
The aim of the study was to analyze signals of transpalpebral rheoophthalmography (TP ROG) by using methods of nonlinear dynamics, to characterize the parameters of nonlinear filtration, and to verify these parameters by testing the TP ROG signals in patients with primary open-angle glaucoma (POAG).
Materials and Methods. Parameters of the nonlinear filter were determined from the data reported by others and from our own studies on multiple TP ROG signals recorded in 10 subjects (mean age 54.2±15.4 years) with no ophthalmic abnormalities. Adjustment and verification of these parameters were performed using TP ROG signals from 10 patients with POAG, divided into two groups: group 1 — six patients with stage II POAG (mean age 72.0±8.2 years) and group 2 — four patients with stage III POAG (mean age 69.4±6.8 years).
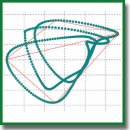
To analyze the obtained TP ROG signals, a method of nonlinear dynamics with the signal attractor formation was employed; within this approach, the time delay value was selected, the phase space dimension was determined, and the attractor was created within the selected coordinates. After calculating the barycenter of each attractor, the TP ROG signals were graphically analyzed in the phase space of the attractors representation.
Results. Using the nonlinear dynamics to process TP ROG signals provided for a better signal differentiation by time as compared with the previously used signal processing. The nonlinear filtering makes it possible to represent the TP ROG signal (within the selected coordinates) by an attractor, which characterizes the amplitude, temporal and structural features of the signal directly related to the biophysical parameters of eye blood vessels. The technique of signal analysis was also tested in patients with POAG. It was found that the barycenter of the newly created attractor can move within the selected coordinates, and this change depends on the stage of the disease. The results allow one to help diagnose the disease in early stages; the method can also be used to look further into the relationship between eye hemodynamics and glaucoma.
Conclusion. A technique is proposed for a quantitative comparison between different TP ROG signals; the method is based on the location of the attractor barycentre within the selected coordinates. The suggested nonlinear filtering algorithm makes it possible to discern between those signals considering the totality of its amplitude and temporal characteristics. The technique is verified by testing TP ROG signals from patients with POAG of different stages, thus further supporting this method of processing and analyzing information on the eye blood flow.
- Goldberger A.L. Non-linear dynamics for clinicians: сhaos theory, fractals, and complexity at the bedside. Lancet 1996; 347(9011): 1312–1314, https://doi.org/10.1016/s0140-6736(96)90948-4.
- Subramaniam B., Khabbaz K.R., Heldt T., Lerner A.B., Mittleman M.A., Davis R.B., Goldberger A.L., Costa M.D. Blood pressure variability: can nonlinear dynamics enhance risk assessment during cardiovascular surgery? J Cardiothorac Vasc Anesth 2014; 28(2): 392–397, https://doi.org/10.1053/j.jvca.2013.11.014.
- Ishbulatov Y.M., Karavaev A.S., Ponomarenko V.I., Kiselev A.R., Sergeev S.A., Seleznev E.P., Bezruchko B.P., Prokhorov M.D. Phase synchronization of elements of autonomic control in mathematical model of cardiovascular system. Nelineinaya dinamika 2017; 3(13): 381–397, https://doi.org/10.20537/nd1703006.
- Lazarenko V.I. Funktsionalnaya reografiya glaz [Functional rheography of the eyes]. Krasnoyarsk: rastr; 2000; 160 p.
- Luzhnov P.V., Parashin V.B., Shamaev D.M., Iomdina E.N., Markosyan G.A., Napylova O.A. Use of tetrapolar methods during rheoophtalmography for an estimation of blood supply inside an eye. Biomeditsinskaya radioelektronika 2012; 10: 18–21.
- Luzhnov P.V., Shamaev D.M., Iomdina E.N., Tarutta E.P., Markosyan G.A., Shamkina L.A., Sianosyan A.A. Transpalpebral tetrapolar reoophtalmography in the assessment of parameters of the eye blood circulatory system. Vestnik Rossiiskoi akademii meditsinskikh nauk 2015; 70(3): 372–377, https://doi.org/10.15690/vramn.v70i3.1336.
- Iomdina E.N., Luzhnov P.V., Shamaev D.M., Tarutta E.P., Kiseleva T.N., Markossian G.A., Ramazanova K.A., Napylova O.A., Kuryleva I.M., Shamkina L.A. An evaluation of transpalpebral rheoophthalmography as a new method of studying the blood supply to the eye in myopia. Rossijskij oftal’mologiceskij zurnal 2014; 7(4): 20–24.
- Shamaev D., Luzhnov P., Pika T., Iomdina E., Kleyman A., Sianosyan A. Applying transpalpebral rheoophthalmography to monitor effectiveness of the treatment of patients with glaucoma. International Journal of Biomedicine 2016; 6(4): 287–289, https://doi.org/10.21103/article6(4)_oa8.
- Luzhnov P.V., Parashin V.B., Shamaev D.M., Shamkina L.A., Iomdina E.N., Markosyan G.A., Napylova O.A., Tarutta E.P. Modelling features of various eye environments at rheoophthalmography. Biomeditsinskaya radioelektronika 2013; 10: 35–39.
- Shamaev D.M., Luzhnov P.V., Iomdina E.N. Modeling of ocular and eyelid pulse blood filling in diagnosing using transpalpebral rheoophthalmography. EMBEC & NBC 2017; 65: 1000–1003, https://doi.org/10.1007/978-981-10-5122-7_250.
- Ivanov L.B., Makarov V.A. Lektsii po klinicheskoy reografii [Lectures on clinical rheography]. Moscow: Antidor; 2000; 320 p.
- Luzhnov P.V., Pika T.O., Shamaev D.M., Nikolaev A.P. Features of the form parameters definition during the rheographic signals analysis. Biomeditsinskaya radioelektronika 2015; 7: 25–30.
- Sokolova I.V., Ronkin M.A., Maksimenko I.M. Osnovy pulsovoy gemodinamiki [Fundamentals of pulse hemodynamics]. Moscow: Samshit-izdat; 2007; 172 p.
- Shilnikov L.P., Shilnikov A.L., Turaev D.V., Chua L. Metody kachestvennoy teorii v nelineynoy dinamike [Methods of qualitative theory in nonlinear dynamics]. Moscow–Izhevsk; 2003; 428 p.
- Gracia J., Seppä V.-P., Pelkonen A., Kotaniemi-Syrjänen A., Mäkelä M., Malmberg P., Viik J. Nonlinear local projection filter for impedance pneumography. EMBEC & NBC 2017; 65: 306–309, https://doi.org/10.1007/978-981-10-5122-7_77.
- Luzhnov P.V., Shamaev D.M., Iomdina E.N., Markosyan G.A., Tarutta E.P., Sianosyan A.A. Using quantitative parameters of ocular blood filling with transpalpebral rheoophthalmography. In: Eskola H., Väisänen O., Viik J., Hyttinen J. (editors). EMBEC & NBC 2017. IFMBE Proceedings, vol. 65; p. 37–40, https://doi.org/10.1007/978-981-10-5122-7_10.